
Micro-Labs, Inc.
Comanche Trail sales@microlabs.com |

Micro-Labs, Inc.
Comanche Trail
Austin, Texas 78732, USAsales@microlabs.com
TradeStation Developers Since 1999
MoneyVolume ä Indicator
For TradeStation® 10 (and prior), 2000i, Pro, 6, 7, 8, SuperCharts 4
© Copyright 2000 Micro-Labs, Inc. All rights reserved
������������������� TABLE OF CONTENTS
Introduction..................................................................................................... 2
Installation........................................................................................................ 2
Applying the MoneyVolume Indicator......................................................... 3
Interpretting the MoneyVolume Indicator.................................................. 4
Example of MoneyVolume in Operation..................................................... 5
Advanced Parameter Settings....................................................................... 8
Using the MoneyVolume Function............................................................... 9
MoneyVolume Theory of Operation.......................................................... 11
Technical Support......................................................................................... 11
Limited Waranty, Disclaimers and Limitations of
Remedy.................... 12
License Agreement....................................................................................... 13
Trademark Acknowledgements.................................................................. 13
Rev
2.01
INTRODUCTION
The MoneyVolume Indicator for
Tradestation attempts to reveal buying/selling pressure and/or
accumulation/distribution in a security, which is not yet reflected in the
security price.
MoneyVolume is a technical
indicator calculated from both a security�s price and volume. It works equally
well in any time frame. It would usually be overlaid in the same window as the
security although it can be placed in a separate window. MoneyVolume is
interpreted by comparing MoneyVolume to price to see if a positive or negative
divergence has formed.
INSTALLATION
To transfer the MoneyVolume
indicator into your program, you will need to use the ELA (Easy Language
Archive) Transfer Utility that is built into the TradeStation Power Editor or
the SuperCharts Quick Editor. Once you have the MoneyVolume indicator in your
Program it will appear in the Function Library and you can apply it to charts
or use it in trading systems.
TradeStation
6, 7:
1. Insert
the �MoneyVolume Indicator� diskette into drive A:
2. Left
click on File, then left click on Import/Export Easylanguage�
3. Choose
the option: �Import EasyLanguage file (ELD, ELS or ELA) then click on NEXT>.
4. In the
�File name:� box type
5. �A:\moneyvol.els�
and Left click on NEXT>. A window should appear with a check mark by both
Function and Indicator. Left click on NEXT> again.
6. A
window should appear with a check mark by MoneyVolume Function, MoneyVolume
Indicator, and WeightedPrice Function. Left click on FINISH.
7. Left
click on OK twice to complete the transfer.
TradeStation
2000i:
1. Insert
the �MoneyVolume Indicator� diskette into drive A:
2. Go into
the EasyLanguage Power Editor. (press F12 from within ProSuite 2000i)
3. Left
click on FILE, then on IMPORT AND EXPORT.
4. Choose
the option: �Import EasyLanguage Archive or Storage File (ELA or ELS)� then
click on NEXT>.
5. In the
�Select the location of your EasyLanguage Archive file� box type
�A:\moneyvol.els�
and Left click on NEXT>. A window should appear with a check mark by both
Function and Indicator. Left click on NEXT> again.
6. A
window should appear with a check mark by MoneyVolume Function, MoneyVolume
Indicator, and WeightedPrice Function. Left click on FINISH.
7. The
transfer should complete and you may close the EasyLanguage Power Editor.
TradeStation
4:
1. Insert
the �MoneyVolume Indicator� diskette into drive A:
2. Go into
the EasyLanguage Power Editor.
3. Left
click on FILE, then on OPEN.
4. Click
on the Transfer button.
5. Choose
the option: 'Transfer Analysis Techniques FROM EasyLanguage Archive File
(.ELA)' then click OK.
6. In the
�From� box type �A:\moneyvol.els� then click OK.
7. On the
next Menu, choose TRANSFER ALL, then click OK.
8. The
transfer should now be complete and you may close the EasyLanguage Power
Editor.
�SuperCharts (4 and above only):
1. Insert
the �MoneyVolume Indicator� diskette into drive A:
2. Go into
the Quick Editor by choosing TOOLS, then OPTIONS, then Quick Editor.
3. Left
click on TRANSFER.
4. Choose
the option: 'Transfer Analysis Techniques FROM EasyLanguage Archive File
(.ELA)' then click OK.
5. In the
�From� box type �A:\moneyvol.els� then click OK.
6. On the
next Menu, choose TRANSFER ALL, then click OK.
7. The
transfer should now be complete.
APPLYING THE MONEYVOLUME
INDICATOR
The installation process
described above only needs to be completed once. After installation, you are
ready to apply the MoneyVolume Indicator to a chart. The steps to do this are
as follows:
1.
Open up a chart and then Left click inside the chart
window where you want to add the indicator.
2.
On the menu, Left click on INSERT and then INDICATOR.
3.
Scroll down until you see MoneyVolume. Left click on
MoneyVolume to highlight it and then Left click on OK.
4.
Left click on the Style tab and set the Type to be Line
and then click OK.
5.
Left click on the Scaling tab and set Scale type to
Screen and then click OK. If you want MoneyVolume to overlay the price graph
(recommended) instead of being in a separate subgraph, then left click on
Properties and set Subgraph to One and click OK. Leave all Inputs set to their
default values for now. These values are explained in the section: Advanced
Parameter Settings.
6.
You should now see MoneyVolume plotted on your chart.
INTERPRETTING THE
MONEYVOLUME INDICATOR
The MoneyVolume Indicator for
Tradestation attempts to reveal buying/selling pressure and/or
accumulation/distribution in a security, which is not yet reflected in the
security price.
MoneyVolume is a technical indicator calculated from both a security�s price and volume. It works equally well in any time frame. It would usually be overlaid in the same window as the security although it can be placed in a separate window. MoneyVolume is interpreted by comparing MoneyVolume to price to see if a positive or negative divergence has formed. For example, if price surpasses its previous peak and the corresponding MoneyVolume indicator does NOT, it constitutes a negative divergence between price and MoneyVolume. The theory being that since the price peak is unconfirmed by the indicator, it should eventually result in the price pulling back. When considering these factors, it is important to note how reliably MoneyVolume worked in the past on a particular security and/or within the context of a particular time frame. If the indicator did not work reliably in the past, it stands to reason that is might not work in the future.� It may also be helpful to look at MoneyVolume versus price on slightly different time frames. The more consistent the divergence is over several similar time frames, the more reliable the divergence would be considered.� MoneyVolume would tend to be less indicative for very thinly traded issues which have only slight and/or sporadic volume in the time frame being observed.
Note that when MoneyVolume is shown on the same chart as price that the two lines do not always start in the same place on the left side of the screen and when the compression of the bars is changed it sometimes changes the position of the two lines relative to each other. This is because MoneyVolume and price have very different values and Tradestation has to scale them to fit the screen when putting them on the same graph. So when the compression is changed, different amounts of data are displayed on the screen and Tradestation scales them such that the visible data for each line is expanded to fill the screen. That is why you have to visually judge how MoneyVolume moves versus price, look for divergences, and not just look at the absolute position of the two on the same graph.
EXAMPLES OF MONEYVOLUME IN
OPERATION
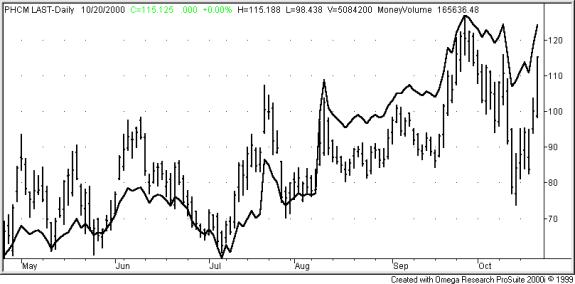
This is an example of a daily
chart where MoneyVolume gives us a number of clues as to the future direction
of the price. Note how the four rallies from May through July are unconfirmed
by a corresponding increase in MoneyVolume. In each case the rallies failed and
pulled back to the MoneyVolume line. However, in the late July pullback note
how MoneyVolume holds at the same height as the peak in June while price is
lower. This divergence is our first clue to the change in character about to
take place. Beginning with the August rally, note how MoneyVolume confirms the
rallies with new highs and relative strength. Now, instead of MoneyVolume
diverging with the rallies, it diverges with the pullbacks. Price drops much
more than MoneyVolume during the four pullbacks from late August through
October. In each case the stock price moves to catch up with the MoneyVolume
indicator.
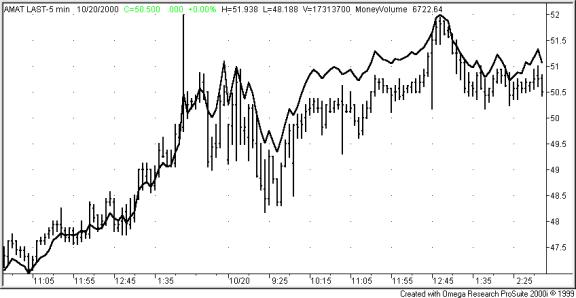
In this 5 minute chart of
Applied Materials, we can observe that MoneyVolume tracks the price fairly well
at the beginning of the chart which only tells us that we have no divergence
and price is moving� in step with
MoneyVolume. Since we have a track record of�
no divergence then when we do have a divergence, we can have more confidence
in the signal than for a stock where MoneyVolume and Price do not correspond as
well. Note that 90% of the time, MoneyVolume will tell us absolutely nothing
that we can�t already observe from the price. However, since we have so many
thousands of securities to select from, we are free to keep studying charts
until we find one in the 10% where we do see something.
In this chart the price starts
diverging from MoneyVolume at the beginning of the day on 10/20. MoneyVolume
does not fall as far as price and around 11:30 it makes a new high and starts
rising about 12:00 giving us a few minutes warning of the impending rally. Note
that at 12:45 price catches up to MoneyVolume, warning us that we probably need
to consider taking our profits or at least start setting tight stops.� Note that what is more important than the
absolute values of MoneyVolume is the relationship of the behavior of
MoneyVolume versus price. So while MoneyVolume did make a new high at 12:45 which
would normally be a confirmation of the new high in price, we were suspicious
of the rally in price because it was the first time since 9:00 that the price
had caught up with MoneyVolume.
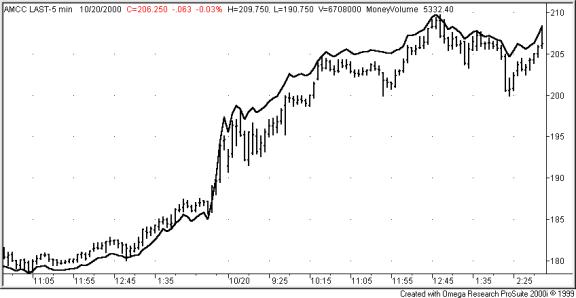
In this 5 minute chart of
Applied Micro Circuits we see MoneyVolume tracking price fairly closely up
until about 9:00 on 10/20. From that point on, MoneyVolume leads price higher,
confirming the new highs in price and holding when price pulls back.
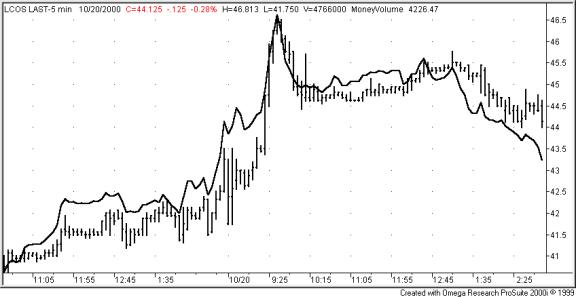
In this 5 minute chart of
Lycos, MoneyVolume shows a positive divergence at 11:55 and 2:00 of 10/19. On
10/20 at 9:00 we see another positive divergence of MoneyVolume preceding a
nice move to the upside in price. Also notice the negative divergence at 1:00
on 10/20 which appears in plenty of time to exit the position or go short prior
to the drop in price.
ADVANCED PARAMETER
SETTINGS
Since the interpretation of
MoneyVolume versus price divergences are somewhat subjective, we have developed
some more objective measures of interpreting MoneyVolume. These methods can be
used either in conjuction with the basic MoneyVolume versus price divengence
interpretation or as stand-alone Indicators. Several examples are given in the
next section, but the most basic way of looking at MoneyVolume is to determine
if it is currently above or below its own moving average.
By changing parameters in the
MoneyVolume Indicator, the MoneyVolume plot can be set to show one color when
it is above its moving average and a different color when it is below. The
Input parameters and their descriptions follow:
The MoneyVolume plot is shown
only in the one color which is set by the Format Indicator Color setting.
The MoneyVolume plot is drawn
with two colors as defined by the following parameters.
SimpleMovAvg=True
The color change is determined
by whether the MoneyVolume value is above or below the simple moving average of
MoneyVolume.
SimpleMovAvg=False
The color change is determined
by whether the MoneyVolume value is above or below the exponential moving
average of MoneyVolume.
AboveColor=Black, Blue, Cyan,
Green, Magenta, Red, Yellow, White, DarkBlue, DarkCyan, DarkGreen, DarkMagenta,
DarkRed, DarkBrown, Gray, LightGray
Determines the color the
MoneyVolume plot is when it is above or equal to its average.
BelowColor=Black, Blue, Cyan,
Green, Magenta, Red, Yellow, White, DarkBlue, DarkCyan, DarkGreen, DarkMagenta,
DarkRed, DarkBrown, Gray, LightGray
Determines the color the
MoneyVolume plot is when it is below its average.
USING THE MONEYVOLUME
FUNCTION
In addition to the MoneyVolume
Indicator your ELS file also includes the functions WeightedPrice and
MoneyVolume. WeightedPrice is used by the MoneyVolume Function and it simply
returns a value which weights the closing price the highest but also factors in
the price range for that bar.
The MoneyVolume Function can be
passed as an input to a number of traditional/commonly used Indictors instead
of Price. The theory is that MoneyVolume, by incorporating Volume and Price
might give a better signal/representation of what the market is doing than by
simply using Price alone. In the graph below, we have an example of doing this
with four common Indicators supplied with Tradestation:
The subgraphs and their
settings are described below:
ChangeColor=True, SimpleMovAvg=True, AboveColor=Cyan, BelowColor=Magenta, MovingAvgLen=12
Scaling set to �Screen�
Scaling set to �Screen�
Price=MoneyVolume, Length
(Simple Moving Average)=12, Displacement=0
Scaling set to �Same as Symbol�
ChangeColor=True, SimpleMovAvg=True, AboveColor=Cyan, BelowColor=Magenta, MovingAvgLen=12 (This should be set to the same number as Length Above)
Scaling set to �Same as Symbol�
Price=MoneyVolume, Length
(Simple Moving Average)=12, Displacement=0
Scaling set to �Same as Symbol�
ChangeColor=True, SimpleMovAvg=False, AboveColor=Cyan,
BelowColor=Magenta, MovingAvgLen=12 (This should be set to the same number as Length Above)
Scaling set to �Same as Symbol�
Price=MoneyVolume, Length=14,
OverSold=30, OverBought=70,
OverSColor=DarkRed,
OverBColor=DarkBlue
Scaling set to �User Defined�
Maximum=100, Minimum=0
Price=MoneyVolume,
FastLength=8, SlowLength=20, Displacement=0
Scaling set to �Same as Symbol�
MONEYVOLUME THEORY OF
OPERATION
MoneyVolume is similar to On
Balance Volume and Moneystream indicators in that it is a cumulative indicator
based on volume and price movement. On Balance Volume works by adding volume of
a particular bar if the price bar goes up and subtracting if it goes down.
However, it adds the total volume for that bar whether the price moves 1/16 or
1 point. It could be argued that the 1/16 point volume was either not relevant
or less relevant than the volume of the 1 point move. Moneystream works by
adding the volume of a particular bar multiplied by the price change of that
bar from the last bar. However, if price moves dramatically on lower than
normal volume, such as on a gap up or down or from the close of one day to the
open of the next, this introduces very large moves in Moneystream. It could be
argued that this movement of Moneystream did not really represent the
underlying consistent accumulation/distribution, which we are trying to
observe. MoneyVolume attempts to improve on both of these indicators by looking
both at the amount of price movement from one bar to the next as well as the
amount of volume/money, which caused that movement, as well as the relative
price volatility. It then adds or subtracts the weighted amount from the
previous MoneyVolume total. The intent is to show the buying/selling of the
security that is underlying the price movement but not apparently obvious
simply by looking at the security price and volume. The theory being that if
this underlying buying/selling of the security continues that the price will
follow.
The WeightedPrice Function is
also added to your list of available functions as it is needed by the
MoneyVolume Function. Instead of simply basing calculations on only the closing
price, this function considers the range of the price for that bar as well
although the value is weighted to give the most significance to the closing
price.
TECHNICAL SUPPORT
You may contact Micro-Labs
technical support by phone, fax, or email:
972-234-5842� 9-5:30 M-F
972-234-5896 fax
LIMITED WARRANTY,
DISCLAIMERS
AND LIMITATIONS ON REMEDY
We warrant the physical
diskette and physical documentation furnished to you to be free of defects in
materials and workmanship for a period of�
sixty (60) days from the date of purchase. Replacement of defective
disk(s) and documentation is your sole and exclusive remedy in the event of a
breach of warranty. In no event will we be liable for any damages to you or any
other person in excess of the lower of suggested list price or actual
consideration paid for the License to use the Software, regardless of any form
of claim. IN NO EVENT SHALL YOU HAVE ANY CLAIM FOR OR RIGHT TO RECOVER ANY
OTHER DAMAGES, INCLUDING BUT NOT LIMTED TO, LOSS OF PROFIT, INCIDENTAL OR
CONSEQUENTIAL DAMAGES OR OTHER SIMILAR CLAIMS, even if we have been
specifically advised of the possibility of such damages. The entire risk as to
the results and performance of the Software is assumed by you.
Except to the extent explicitly
provided above, the Software is provided �AS IS without warranty of any kind,
express or implied. THERE ARE NO OTHER WARRANTIES WHICH EXTEND BEYOND THE
DESCRIPTION ON THE FACE HEREOF.�
Further, we do not warrant, guarantee, or make any representations
regarding the use, or the results of the use, of the Software in terms of
correctness, accuracy or otherwise. We specially disclaim all other warranties,
express or implied, including, but not limited to, and IMPLIED WARRANTY OF
MERCHANTABILITY OR FITNESS FOR A PARTICULAR PURPOSE. The diskettes(s),
information, and Software are acknowledged not to be �consumer products� within
the meaning of the 15 U.S.C. 2301 (1). Furthermore, you acknowledge that you
are not a �consumer� within the meaning of 15 U.S.C. 2031 (3).
The Software may include
specific and implied buy and sell recommendations pertaining to individual
stocks, options, indices, or other investment vehicles. It should not be
assumed that past performance is any guarantee of future results. Results
obtained from the use of these materials and information are not guaranteed to
be profitable. It should be understood that investing and speculating in the
financial markets involves a certain degree of risk and in some instances may
result in either partial or total loss of one�s capital. The information in these
materials has been obtained from sources which are believed to be reliable, but
cannot be guaranteed as to its accuracy or completeness, whether supplied as
written materials, magnetically or electronically by any means.
LICENSE AGREEMENT
1.
GRANT
OF LICENSE. For the consideration you have paid for the Software, you are
granted a non-exclusive, non-transferable license to possess, use and display
the Software on a single computer unit at a single location at any one time.
2. OWNERSHIP
OF SOFTWARE. Except for your licensed right to possess, use and display the
software under the terms of this License, all title to and rights in the
Software remain with Micro-Labs, Inc.
3. RESTRICTIONS
ON COPYING, REPRODUCTION. By paying a license fee and taking possession of our
Software, you acknowledge that both are copyrighted under and therefore
protected by Federal Law. You Agree not to infringe or contribute to the
infringement of our copyright by copying, reproducing, enhancing, or creating
derivatives of our Software.
4. MODIFICATIONS.
This License may be modified by Micro-Labs, Inc. in conjunction with any
enhancement of the Software.
TRADEMARK ACKNOWLEDGEMENTS
MoneyVolume and Micro-Labs are trademarks of Micro-Labs, Inc.
SuperCharts, TradeStation and the Omega Research Solution Provider
Logo are a trademark of Omega Research, Inc.
All other brand and product names are trademarks or registered
trademarks of their respective
companies
The MoneyVolume Indicator is priced at $70.
Contacts: sales@microlabs.com, support@microlabs.com
Ordering Information: Products can be ordered directly from us by email, fax, or phone. We accept most credit cards through PayPal by clicking on the PayPal icon below. We also accept COD (within the US only plus $7 fee), wire transfer ($20 additional), Western Union, or you can send us a check drawn on a US bank in US$ in advance. Add $6.90 for UPS ground shipping, handling, and insurance for one graphics board shipped within the continental United States. Contact sales with your address for the amount to add if your requirements are different. Let us know if we can be of further assistance.
Trading foreign exchange on margin carries a high level of risk, and may not be suitable for all investors. The high degree of leverage can work against you as well as for you. Before deciding to invest in foreign exchange you should carefully consider your investment objectives, level of experience, and risk appetite. The possibility exists that you could sustain a loss of some or all of your initial investment and therefore you should not invest money that you cannot afford to lose. You should be aware of all the risks associated with foreign exchange trading, and seek advice from an independent financial advisor if you have any doubts.
(c) 2009 Micro-Labs, Inc. Last updated 6/18/09 |